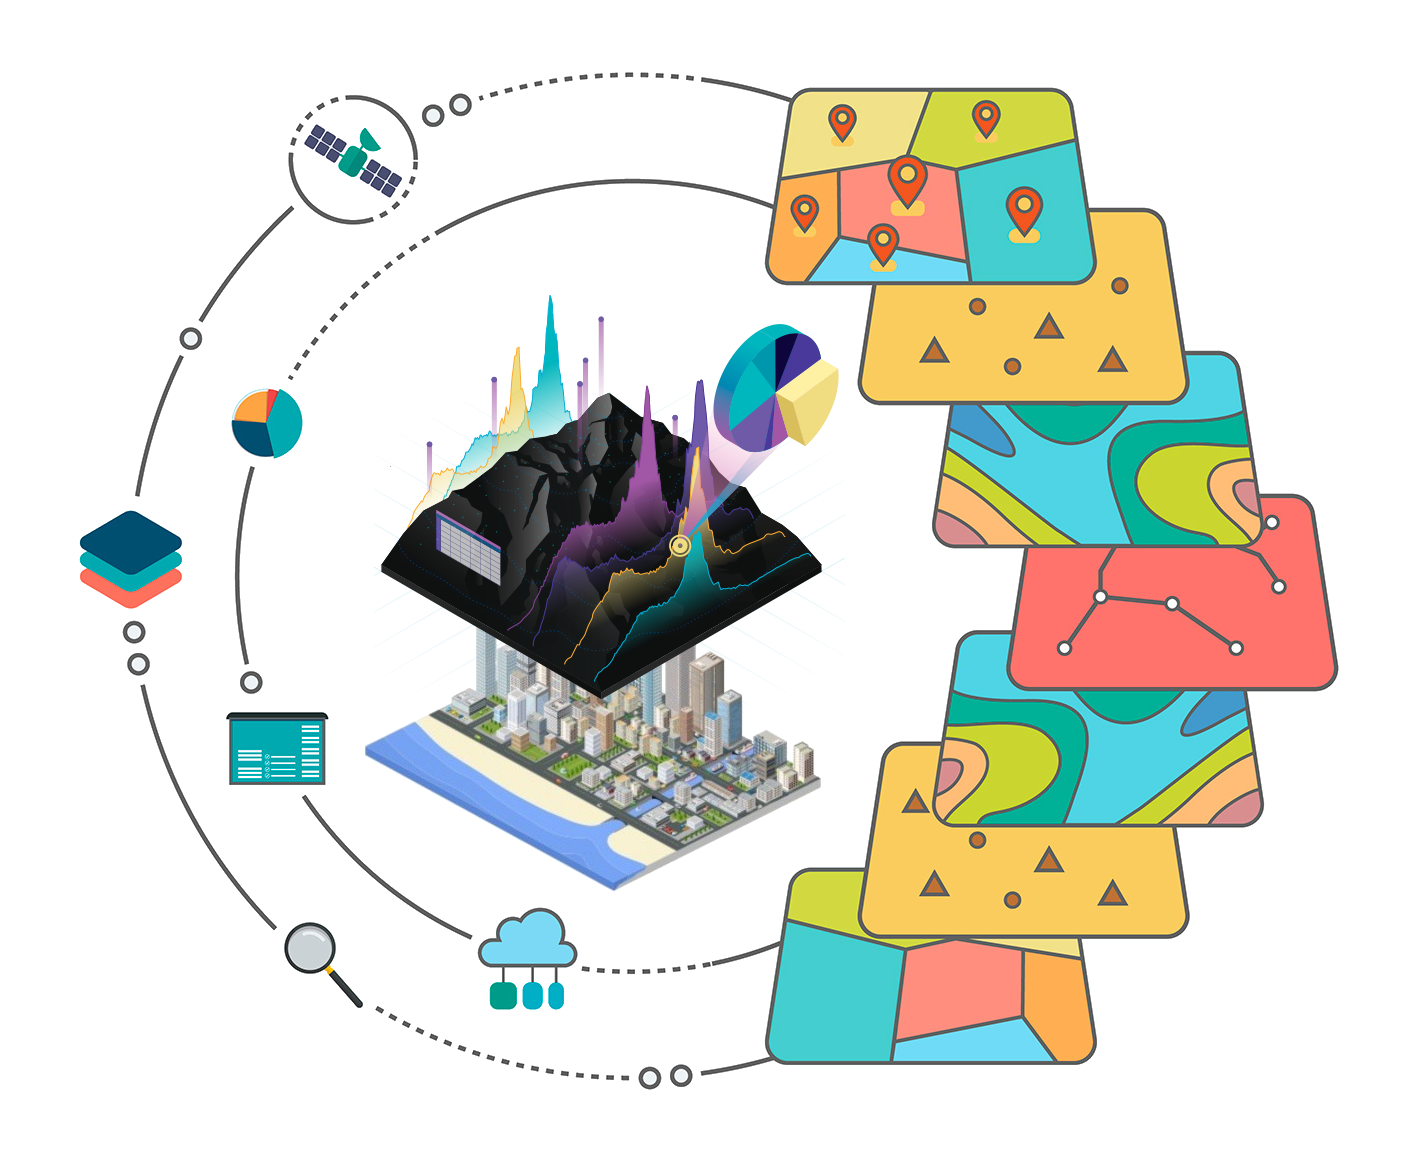
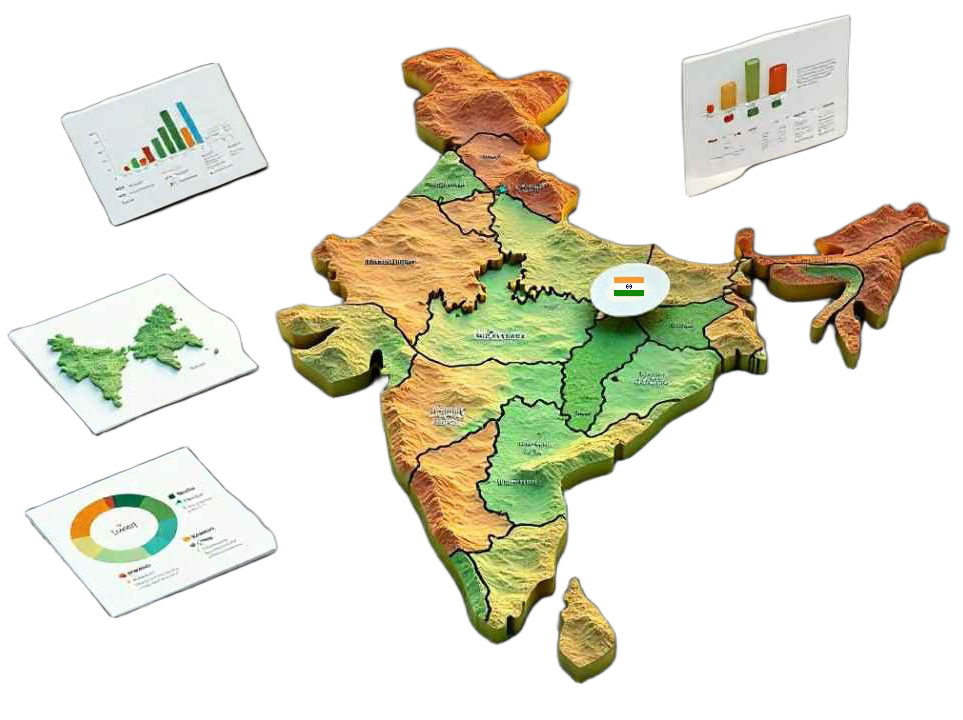
One platform for environmental monitoring, urban insights, and geospatial analytics. Real-time data, boundary-based analysis, and actionable reports—all in one place.
Environmental analysis, boundary-based insights, and reports—powered by one platform
Track urban sprawl and land use changes over time with spatial analysis.
Measure vegetation health and green cover with NDVI and related indices.
Track water extent and quality with spatial and spectral analysis.
Monitor air quality and pollutant levels with spatial data.
Identify flood-prone areas and monitor flood extent and hotspots.
Map urban heat islands and surface temperature patterns.
Assess solar potential and insolation for planning and design.
Detect and monitor open dumping sites with spatial analysis.
Built for accuracy, transparency, and advanced use
Calibrated indices, validated sources, and quality checks so your decisions are based on reliable data.
Scientific, peer-reviewed methods and best practices for each analysis type—repeatable and auditable.
Enterprise-grade platform with scalable processing, secure access, and export-ready reports.
Role-based access, encrypted data, and 24/7 availability for your team.
Machine learning, geospatial analysis, flexible boundaries, and environmental intelligence
ML-based classification & detection
Analysis & cloud-scale processing
Boundary-based mapping & analysis
District, tehsil & village-level analysis
Draw or upload GeoJSON/KML
Indices, trends & insights
Layers, draw tools, exports
PDF, Excel, GeoJSON
A single platform for environmental monitoring, urban insights, and geospatial analysis. Choose your area by boundary or custom shape, run analyses, and get reports—all in one place.
Built for organisations that need reliable environmental data: vegetation health, water bodies, air quality, flood risk, heat islands, solar potential, and more. Sign in to access your dashboard and start analysing.
Enterprise-grade security
Up-to-date information
Data-driven insights & reporting
PDF, Excel, GeoJSON download